Performance
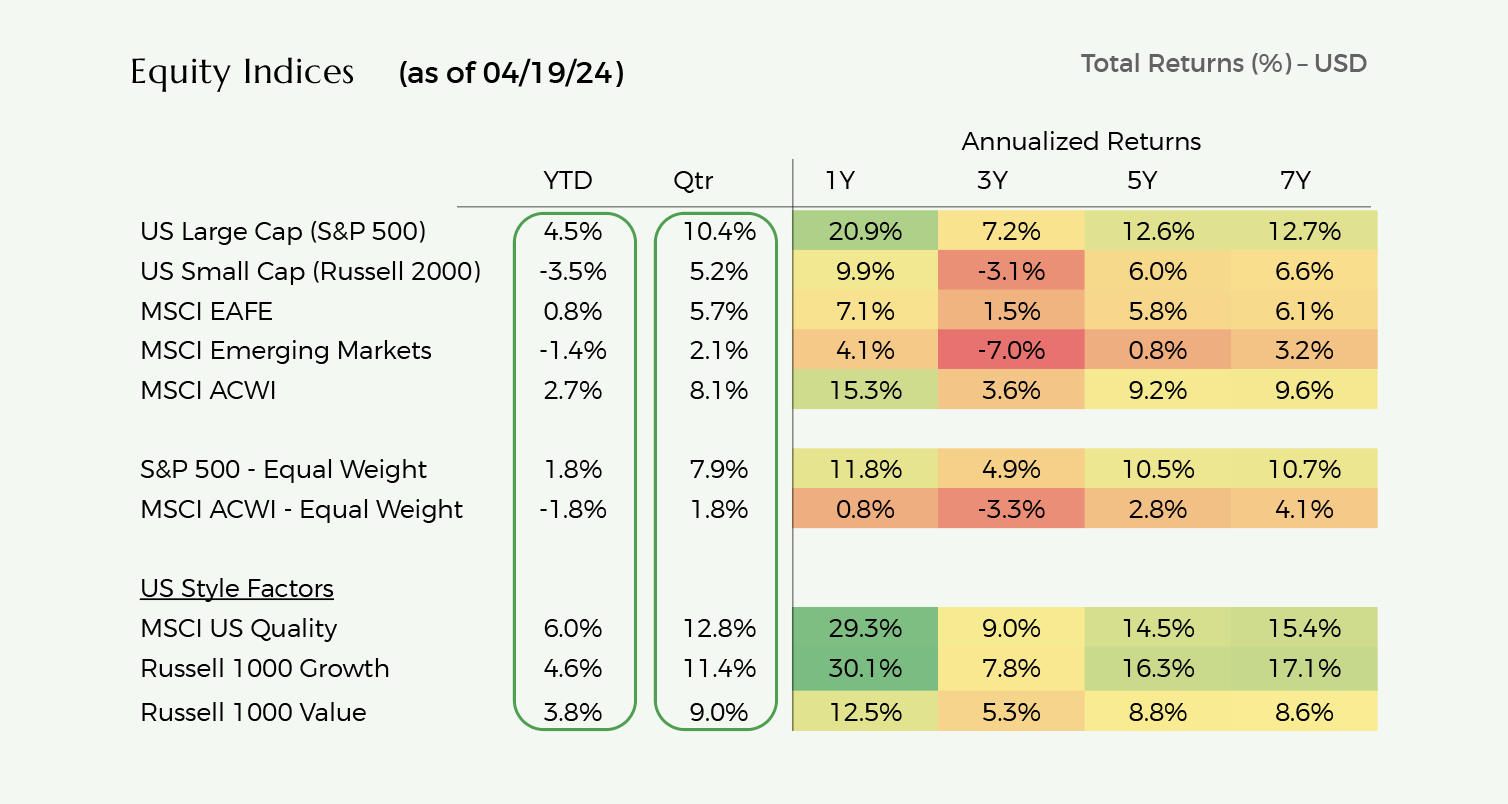
Global equity markets (MSCI ACWI Index) increased by 8.1% during Q1 but have pulled back sharply since then and are now up 2.7% YTD through April 18, 2024.
US large-cap stocks (S&P 500) were up 10.4% and 4.5% in Q1 and YTD respectively. Both international developed (+5.7% Q1 and +0.8% YTD) and emerging market (+2.1% Q1 and -1.4% YTD) stocks have trailed US stocks is USD terms.
Globally, growth stocks (+9.5%) outperformed value stocks (+6.8%) during Q1. Since quarter-end, growth stocks outperformance over value stocks has narrowed (+3.0% vs 2.3%) YTD.
During Q1, technology (+12.1%), communication services (11.4%), energy (+9.4%), industrials (+9.1%) performed best while consumer staples (+2.7%) and utilities (+1.5%) performed worst.
However, in April, almost all sectors have retreated with technology and consumer discretionary stocks faring worst at -8.4%, and -6.3% respectively. Only energy stocks (+1.2%) have been positive during the April equity market pullback.
US large-cap equities (S&P 500) were up +10.4% during Q1 and +4.5% YTD through April 19th.
Q1 and YTD stock performance has largely been driven by a select number of stocks (NVIDIA, Meta),
On an equally weighted basis (as opposed to market-cap weighted), the S&P 500 is only up 1.8% YTD.
In Q1, most sectors performed well with communication services (+15.8%) and energy (+13.7%) leading and consumer staples (+7.5%) and utilities (+4.5%) lagging.
Strong corporate earnings and better than expected economic data drove performance.
Since quarter-end, the S&P 500 is down 5.4% through April 19th with technology (-8.4%) and consumer discretionary sectors (-7.0%) performing worst.
Unfavorable inflation data (indicating slower than expected progress towards the Fed’s 2% inflation goal) coupled with swiftly increasing interest rates have driven the S&P 500 April pullback.
US small cap stocks have continued to underperform large cap stocks.
Small caps were up +5.2% in Q1 but have since declined 8.3%, bringing YTD performance to -3.5%.
Small caps are perceived to strongly benefit from lower interest rates as they tend to be more highly levered. As such, these stocks have pulled back further in April as rates have risen swiftly.
International developed stocks (MSCI EAFE) were up 5.7% during Q1. However, in April, the MSCI EAFE index declined by 4.6% trimming YTD gains to 0.8%.
European stocks appreciated by 5.0% in Q1 and 1.1% YTD in USD (7.6% in Q1 and 5.1% YTD in Euro terms).
Corporate earnings have held up better than expected and inflation is continuing to decline.
Currency has detracted from YTD returns in USD terms as the USD had strengthened to 1.067 on April 19th vs. 1.104 at YE 2023.
Japanese stocks appreciated by 10.5% in Q1 and 2.7% YTD in USD (+18.8% in Q1 and +12.8% YTD in Yen terms).
In local markets, Japanese stocks have benefitted from a) reforms and increasing shareholder friendly actions on behalf of large corporations, and b) Yen weakness driving increased local currency revenues and profits as many Japanese corporations have large overseas revenues coupled with largely domestic cost bases.
However, Yen weakness (Yen has depreciated to 154 on April 19th vs. 141 at YE 2023) has also detracted from stock returns in USD terms.
Emerging markets were up 2.4% during Q1. However, in April, the MSCI EM Index declined by 3.6% and is now down -1.4%.
During Q1, Indian equities were up 5.5%, Taiwanese equities were up 12.5% and Korean equities were up 1.6% in USD.
Indian equities benefitted from strong economic data and corporate earnings and a relatively stable currency.
Korean (+6.2%) and Taiwan (+17.5%) equity markets performed even better in local currencies but currency depreciation vs. the dollar detracted from those gains in USD terms. Strong results from semiconductor companies supported by robust AI spending demand drove performance.
Since quarter-end, Korean and Taiwanese equities declined by 8.9% and 6.7% in USD terms as semiconductor companies gave back gains as part of broader technology sector declines and as currencies depreciated further vs. the dollar.
The MSCI USA Quality and Russell 1000 Growth Indexes have substantially outperformed the broader S&P 500 over the past seven years.
Both indexes have benefitted from overweights to the US technology and communication services sectors (mainly internet companies)
However, over the past three years, there has been a bifurcation of performance within quality stocks. Non-technology stocks have materially underperformed their quality stock counterparts in technology sectors. Since active managers have high active shares, they tend to underweight exposure to the Magnificent Seven and in some cases to the broader technology sector. As such, US active managers focused on buying quality companies have generally underperformed their respective US benchmarks over the past three years.
The Quality Index has disproportionately benefitted from its significant overweight to NVDA over the past year.
US growth and quality stocks appear modestly expensive relative to historical averages.
Operating fundamentals for the technology and communication services (internet) sector have been very strong over the past 6-12 months.
Revenue growth has accelerated while cost reduction continues leading to outsized earnings growth.
However, YOY comparisons become more difficult in H2 and with higher valuations coupled with lofty investor expectations, these stocks may face pullbacks if results falter or if rates continue to increase.
Investors will especially scrutinize expense levels and capital spending with regards to AI plans which seem to be accelerating.
US value stocks (healthcare, energy, financials, and consumer staples) appear fairly valued relative to history.
Operating fundamentals appear mixed across sectors both in terms of underlying demand and in terms of cost pressures.
For investors with a mid-term time frame, we continue to believe that stocks of high-quality companies will outperform given their strong business models, superior revenue and earnings growth and strong returns on capital.
Over shorter-term time frames, these companies may underperform given their recent strong outperformance (especially technology and communication services stocks) and given elevated investor expectations which may prove challenging to exceed.
Valuation
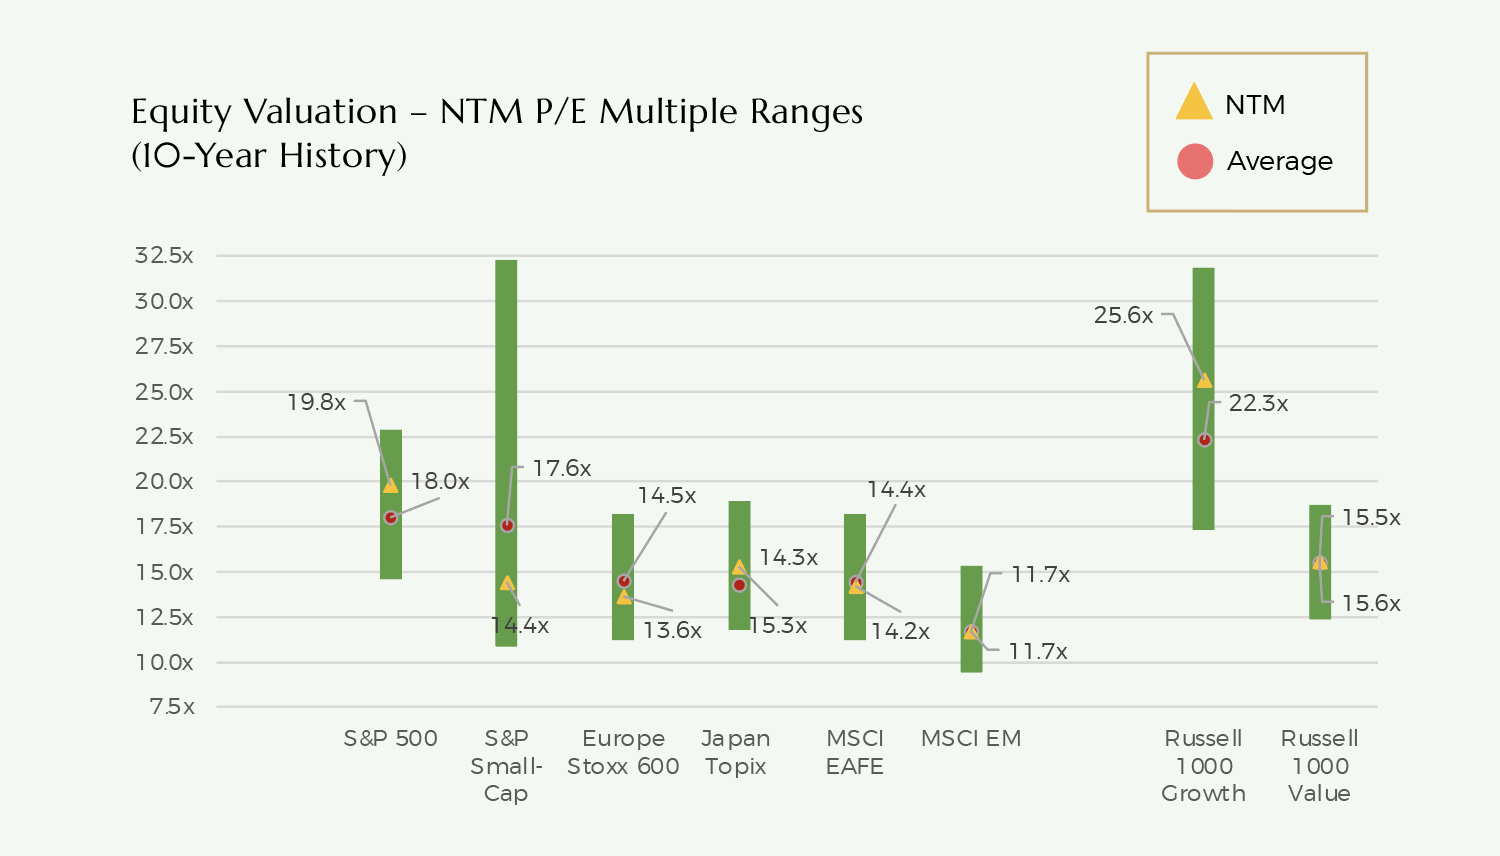
Equity markets are generally fairly valued relative to historical averages.
US markets modestly overvalued and international developed markets fairly valued-to-modestly undervalued.
The S&P 500’s valuation is nuanced however. While the market-cap weighted S&P 500 Index trades at 19.8x NTM P/E, the equal-weighted S&P 500 trades at 16.5x NTM P/E (inline with historical averages).
The S&P 500 has high concentration among a relatively narrow set of stocks, and the technology sector accounts for 30% of the index. Although the S&P 500’s valuation may look expensive relative to history, this increase seems largely due to the changing composition of the index and its shift towards much higher quality companies that have exhibited staying power while delivering attractive earnings growth.
US large-cap equity market valuations are expensive relative to government bonds.
The S&P 500 presently trades at 19.8x consensus NTM earnings.
Historically, the S&P 500 earnings yield (inverse of multiple) has averaged 200-300bps over 10-Year Treasuries.
With 10-year Treasuries yielding 4.6%, at first glance, a 13.0x-15.0x forward EPS multiple is “fair” for the S&P 500 based on relative valuations to bonds.
However, most investors do not expect the 10-year Treasury to remain at 4.6% for an extended period of a time. If the 10-year was to retreat to 3.5%, a fair valuation of 16.0x-18.0x forward EPS is more reasonable (based on historical relationships). Again, we can debate whether these historical relationships should hold given the changes in sectoral composition for the S&P 500 and the sustainable secular growth trajectories associated with several stocks within the technology sector (largest weighting in the S&P 500).