Introduction
Conventionally, investors construct portfolios based upon “traditional” asset allocation concepts. These concepts include a) asset class diversification, and b) target exposures across certain asset classes – either fixed percentages or prescribed ranges. At the most simplistic level, a traditional marketable securities portfolio may consist of a 60 Equities / 40% Fixed Income allocation. At a more complex level, the portfolio may have allocations to hedge funds as well as several sub-categories within equities and fixed income. For purposes of this whitepaper, we only consider reasonably liquid marketable assets (equities, fixed income, and hedge funds) and exclude private equity, other private investments and private real estate.
In theory, the convention asset allocation approach has some practical appeal. Generally speaking, over multi-year time periods, equities have delivered higher returns with higher risk when compared to fixed income, with alternatives having a risk / return profile somewhere in between. As such, one might reasonably infer that adding fixed income and alternatives to equities should reduce risk and lead to balanced portfolio construction.
In this paper, we illustrate some of the pitfalls behind this common approach. We further highlight the merits behind the concepts of Risk Buckets and Risk Budget Utilization, which we believe constitute a better approach to portfolio construction across various market environments.
Conventional Asset Allocation
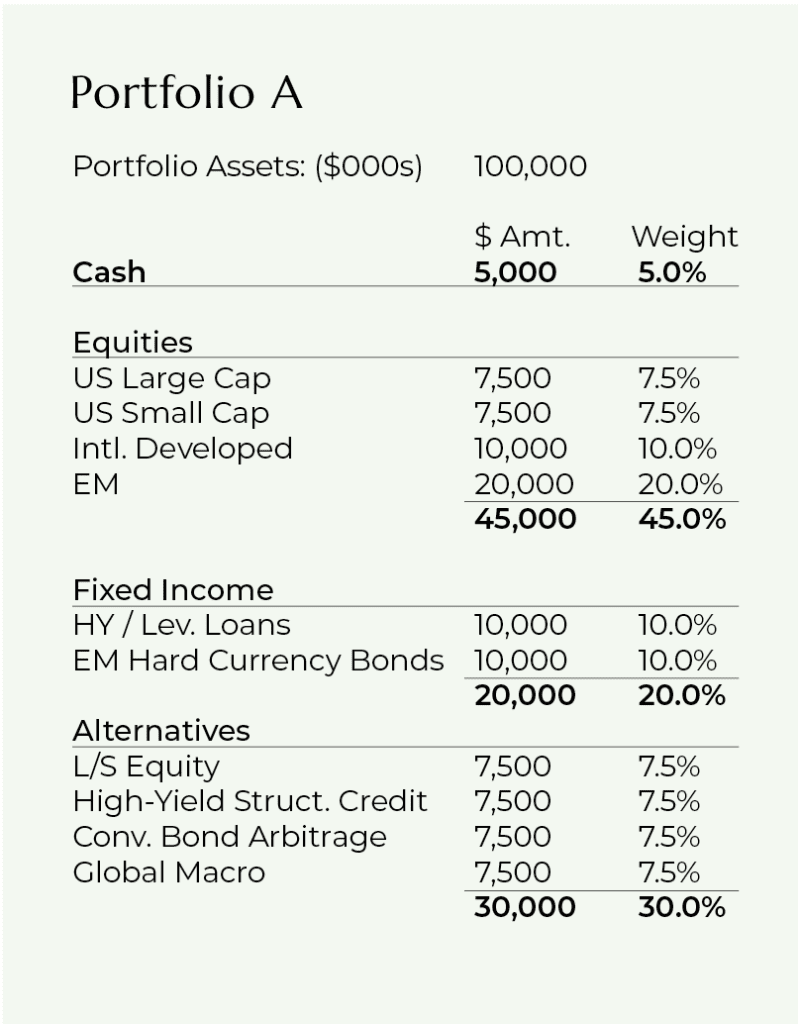
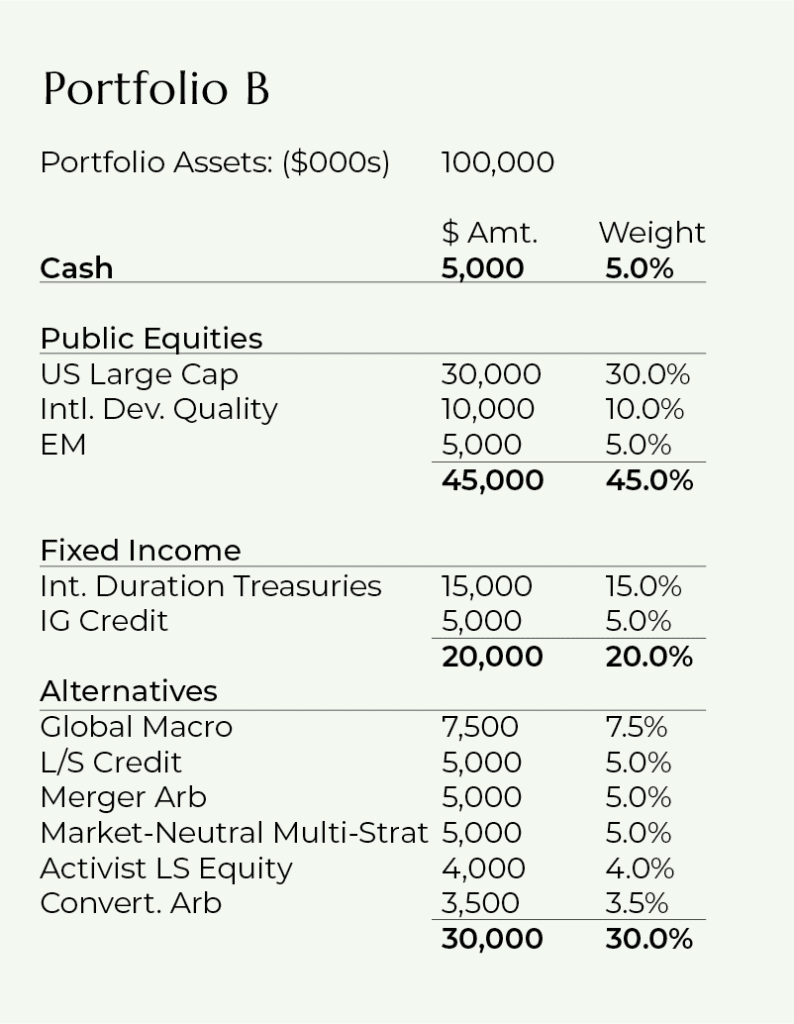
Consider the following two portfolios – Portfolio A and Portfolio B both have similar asset allocations in terms of percentage allocations across broad asset classes. However, the composition of sub-asset classes within broader asset classes is significantly different.
- Portfolio A’s equity allocation has a higher weighting towards international equities, especially emerging markets. For USD-based investors, international equities have historically experienced higher volatility over multiple multi-year periods.
- Portfolio A’s fixed income allocation is comprised of risky corporate credit and EM sovereign credit. Despite being classified as “fixed income”, these assets have high correlation to equities and risk profiles that are fairly similar to equities, especially during periods of stress.
- Hence, the expected return and especially the risk associated with each portfolio is significantly different. In periods of market turmoil, the likely drawdowns associated with Portfolio A are far more severe (again while appearing to have the same balanced allocation across asset classes).
While the conventional asset-class-based asset allocation framework has an appealing simplicity, the framework has several drawbacks including:
- Static target weights which do not take into account fluctuating expected returns.
- If a prescribed periodic rebalancing plan is put into place, this will keep the weights in balance but again does not take into account potential fluctuating returns
- Fixed cash amount which does not allow for flexible, opportunistic “dry-powder” deployment
- Within asset-classes, sub-categories may have significantly varying return / risk expectations. For instance, within fixed income, high-yield bonds, leveraged loans and EM debt will have higher return / higher risk characteristics compared to US Treasuries.
- Additionally, certain sub-asset classes may be more correlated with other broad asset classes (i.e. leveraged loans and EM debt within fixed income are highly correlated with equities whereas US intermediate-maturity Treasuries are negatively correlated with equities). Thus, investors holding leveraged loans or high-yield debt may be fooled into thinking they are achieving a false level of diversification by allocating to fixed income.
- During periods of extreme market stress, traditional longer-term correlation and volatility relationships tend to break down. Correlations tend to converge and become magnified during these periods. Additionally, strategies across asset-classes utilizing leverage (convertible arbitrage hedge funds) may experience equivalent levels of drawdowns to equities despite perceived differences in longer-term volatility profiles.
Risk Buckets and Risk Budget Utilization
Traditional asset allocation divides the portfolio across asset classes. However, as described above, risk within asset class sub-categories can vary significantly.
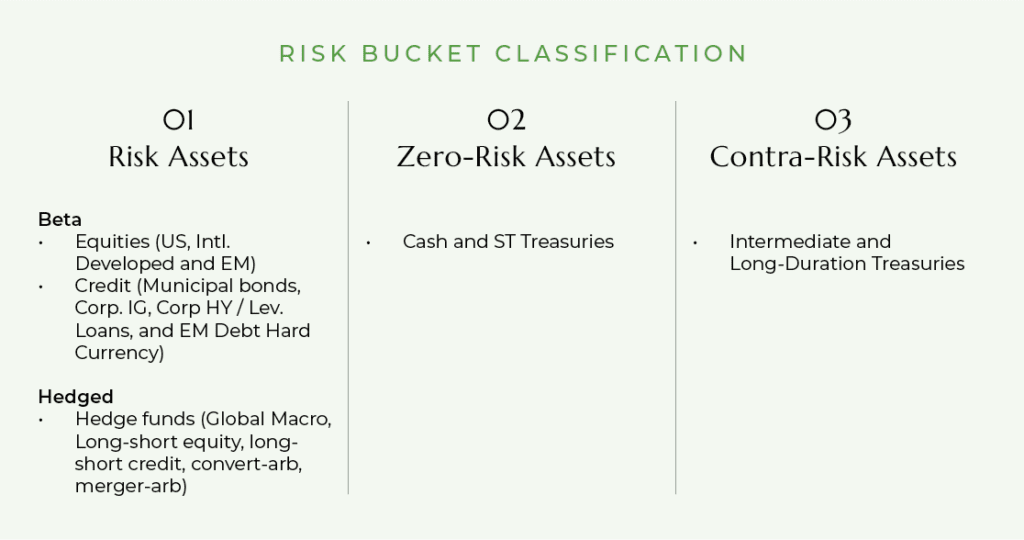
A better way to measure risk across the portfolio is to divide the underlying assets into three Risk Buckets as seen in the table below. This classification is also visually simple and easy to understand for investors.
Risk assets within marketable securities portfolios may be comprised of equities, credit or hedge funds. Investors can assess where the best risk / reward opportunities lie within the risk asset bucket. This distinction can be especially useful in allocating across beta assets (equity vs. credit).
As a reference point, the classification of these buckets is based on relative risk vs. the S&P 500 equity index (for a US base currency investor). As such, contra-risk assets (essentially negative risk) such as intermediate-to-long-duration Treasuries generally tend to appreciate and provide portfolio ballast when the S&P 500 declines sharply (although in highly inflationary environments, both the S&P 500 and intermediate-to-long-duration Treasuries can decline at the same time).
Risk Budget Utilization calculates portfolios’ dollar-based capital usage on a risk-adjusted basis.
Additionally, risk budget utilization bookends minimum and maximum cash / cash equivalent levels. The cash equivalents level above the minimum cash reserve level is referred to as “dry powder”.
- % Risk Budget Deployed = Adj. Risk Utilization $ / (Marketable Portfolio Assets – Min. Cash Reserves)
- If expected return forecasts for risk assets (equities / credit) are highly attractive (high SD / low DD annual returns), investors should draw down on their dry powder and deploy greater amounts of capital towards the Risk Asset bucket. Conversely, if expected returns for risk assets are less attractive (low SD / mid SD), investors should increase their dry powder, move capital out of the Risk Assets bucket, and hold higher levels of cash towards the maximum defined cash limit.
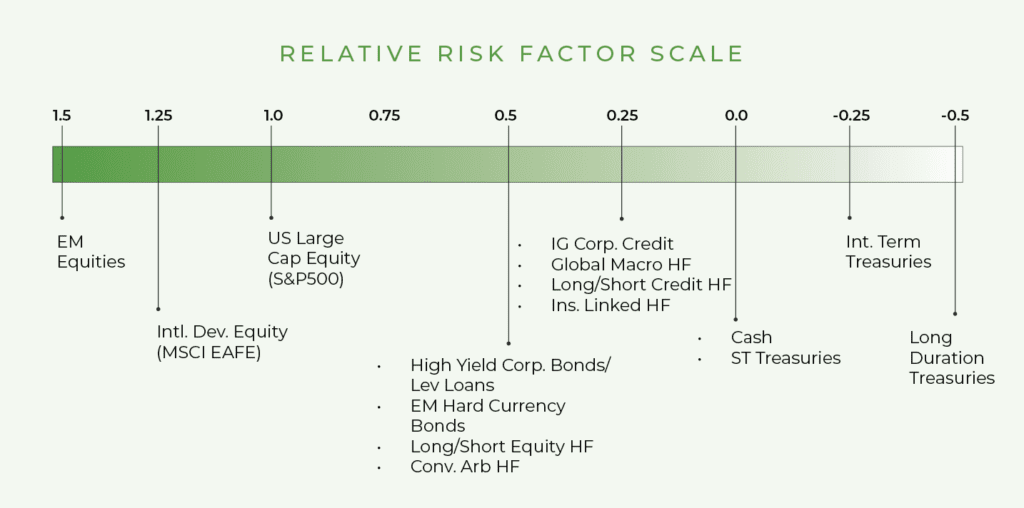
In calculating portfolios’ risk budget utilization, it is necessary to assign relative risk factors (RRFs) to each portfolio asset.
The S&P 500 Equity Index is assigned a base factor of 1. Other assets are assigned a relative factor that is either above or below 1, reflective of our view of each asset’s risk versus the S&P 500. In determining the relative risk, we looked at various factors such as historical volatility over multiple time periods as well as realized volatility in periods of distinct market stress.
Illustrative Hypothetical Portfolios
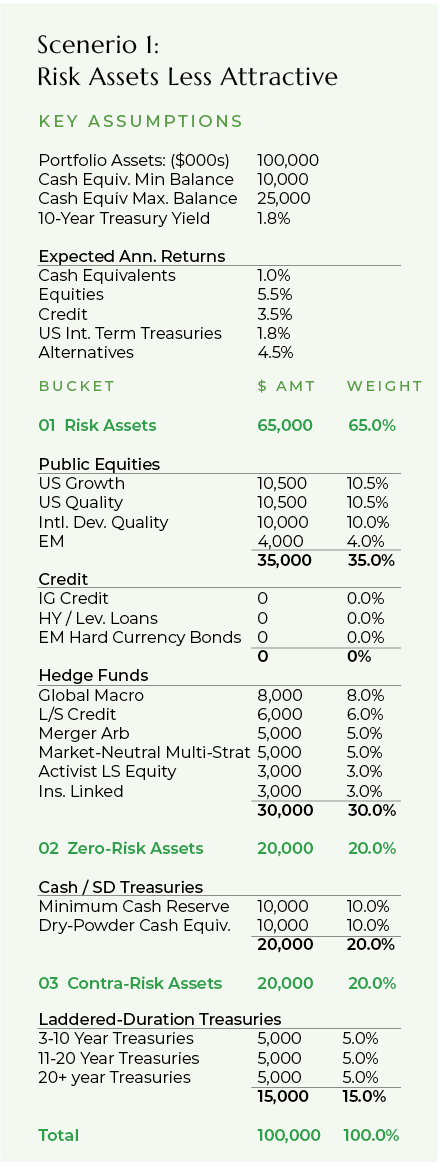
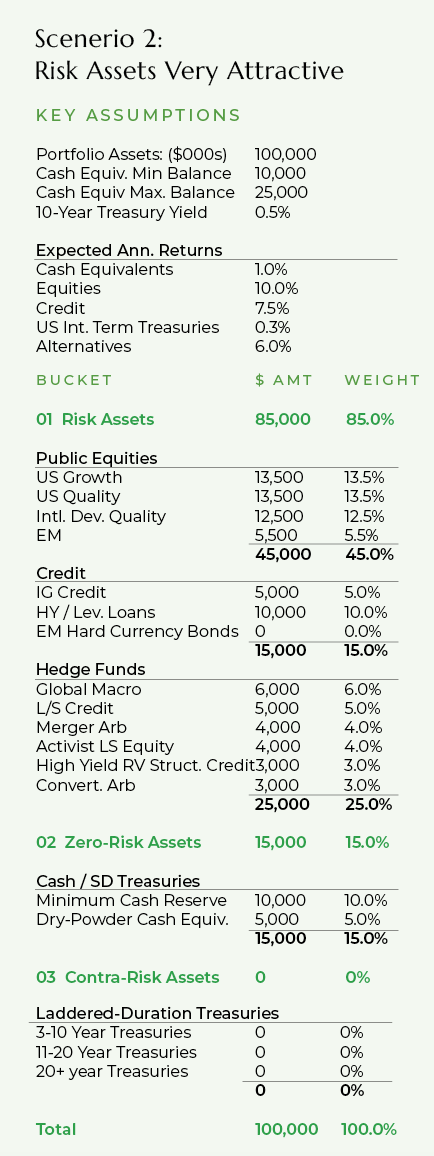
In the tables on the following pages, we illustrate potential portfolio construction under two different scenarios. Scenario 1 represents a hypothetical illustrative portfolio where we deem risk assets less attractive based upon our 7-year expected annual return framework. Conversely, Scenario 2 represents an illustrative portfolio where risk assets are more attractive and have much higher expected returns.
In Scenario 1, there is a lower allocation to Bucket 1 Risk Assets. Within this bucket, there is no allocation to credit and there is a higher allocation to lower-volatility, less-correlated (to equities and credit) hedge fund strategies. The cash-equivalents allocation is near the maximum allowed, leaving $10mm in dry-powder. Finally, there is a 15% allocation to contra-risk assets (intermediate and long-duration Treasuries) given the adequate 1.8% 10-year starting yield and the likelihood for yields to move lower if there is a sharp decline in equity / credit markets.
- Despite deploying $80mm of capital (leaving $20mm in cash), on a risk-adjusted basis, the portfolio’s risk utilization is much lower at $42.2mm
In Scenario 2, there is a much higher allocation to Bucket 1 Risk Assets. The risk allocation is spread between equities, credit and a greater amount of directionally-focused hedge funds (having higher correlation to equities / credit). The portfolio has a lower allocation to cash with less dry powder. Finally, given the very low starting Treasury yields and unattractive expected returns, the portfolio has no allocation to contra-risk assets (i.e. duration-based Treasuries)
- This portfolio only uses an incremental $5mm to reach $85mm in non-cash assets deployed (leaving$15mm in cash or $5mm in dry powder)
- However, on a risk-adjusted basis, the portfolio’s risk utilization is much higher at $69.0mm, an increase of $26.8mm.
Risk Utilization Analysis (Dollar-Weighted)
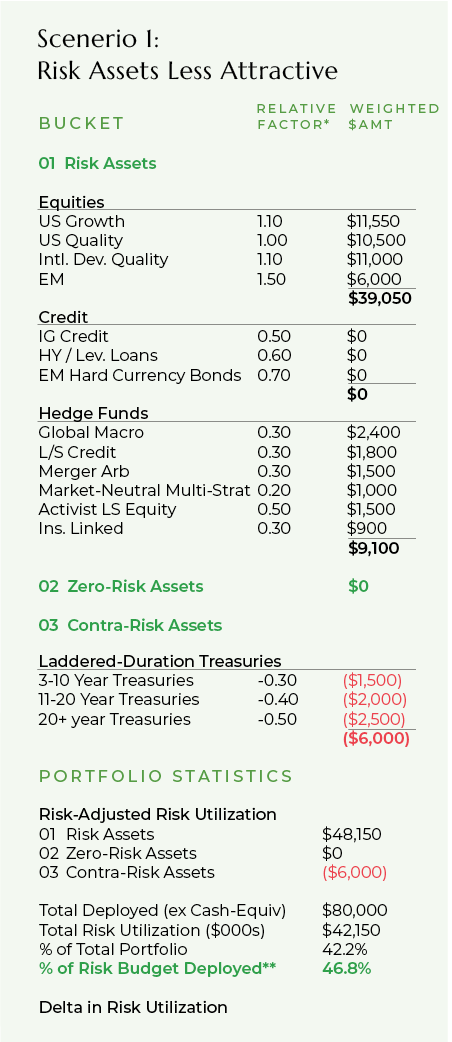
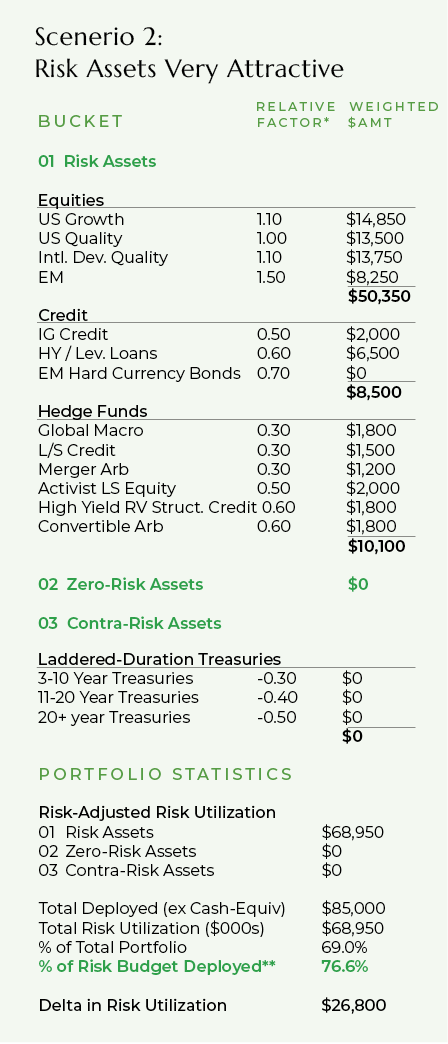
* The Relative Factor is vs. the S&P 500 Equity Index for USD investors; a100% S&P 500 allocation would result in 100% of the risk budget being deployed
** Equals $ Risk Utilization as % of (Portfolio Total Assets – Min. Cash Reserves)