Performance
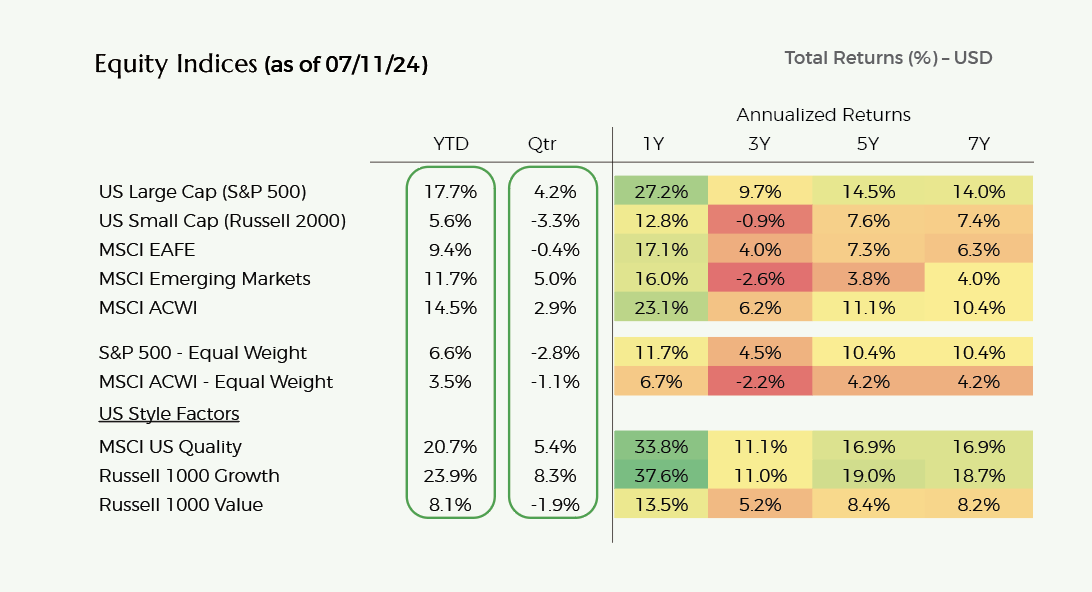
Global equity markets (MSCI ACWI Index) appreciated 2.9% during Q2 and are up 13.6% YTD through July 11th.
US large-cap stocks (S&P 500) were up 4.2% and 17.5% in Q2 and YTD, respectively. Both international developed (-0.4% Q2 and +9.4% YTD) and emerging market (+5.0% Q2 and +11.7% YTD) stocks have trailed US large-cap stock performance.
Globally, growth stocks (+6.2%) significantly outperformed value stocks (-0.6%) during Q2 and YTD (+20.7% vs. +6.8 %).
During Q2, technology (+11.4%), communication services (8.1%), and utilities sectors (+3.6%) performed best, while materials (-3.8%) and industrials (-1.8%) performed worst.
YTD, the technology (+30.4%) and communications services (+23.9%) sectors have performed best.
US large-cap equities (S&P 500) were up +4.2% during Q2 and +17.5% YTD.
Q2 and YTD stock performance has primarily been driven by several stocks (NVIDIA, Meta, Apple, Microsoft, Google) with solid exposure to AI tailwinds.
On an equally weighted basis (as opposed to market-cap weighted), the S&P 500 was down 2.8% in Q2 and is only up 6.6% YTD.
This 13.1% difference in YTD performance is the most significant mid-year differential in history and follows a similar trend in full-year 2023, where the market-cap weighted index substantially outperformed the equal-weight index (+25.7% vs. +13.1%).
Sector performance was mixed during Q2, with strong performance from the technology (+13.7%) and communication services (+9.3%) offset by weaker performance from financials, energy, and industrials sectors (-2% to -3%).
Exceptionally strong earnings and forward guidance as well as continued positive AI sentiment drove the performance of technology and communication services stocks.
Slowing inflation coupled with a still-strong but cooling labor market has led to a reduction in bond yields since the spike in April.
The S&P 500 is now highly concentrated.
The Magnificent Seven now comprise 33% of the S&P 500 in terms of weighting (well above previous highs of 29% at the end of 2021).
US small cap stocks have continued to underperform large cap stocks in Q2 and YTD.
Small caps were down 3.3% in Q2 and are only up 5.7% YTD.
Small cap performance has been hindered by a) less exposure to AI tailwinds, b) higher interest costs associated with higher leverage, and c) more recently, fears of economic slowdowns.
However, small caps may be poised to outperform under a Goldilocks scenario of rate cuts and modest growth as valuations are far cheaper than large cap valuations.
International developed stocks (MSCI EAFE) were down 0.4% during Q2 and +9.4% YTD.
European stocks appreciated by 0.6% in Q2 and 8.9% YTD.
Corporate earnings have held up better than expected and inflation is continuing to decline.
However, European stocks have been weaker over the past month as political uncertainty (French election results) has increased and doubts regarding the pace of the nascent economic recovery have emerged.
Japanese stocks declined by 4.8% in Q2 and are up 13.4% YTD.
Yen weakness detracted from USD stock returns as Japanese stocks were up 1.8% in Q2 and 27.4% YTD in Yen terms.
In local markets, Japanese stocks have benefitted from a) reforms and increasing shareholder friendly actions on behalf of large corporations, and b) Yen weakness driving increased local currency revenues and profits as many Japanese corporations have large overseas revenues coupled with largely domestic cost bases.
Emerging markets were up 5.0% (+6.3% local currency) during Q2 and 11.7% YTD (+15.1% local currency).
During Q2, Indian equities were up 10.2%, Taiwanese equities were up 15.1% and Chinese equities were up 7.1%.
Indian equities benefitted from strong economic data, corporate earnings and a relatively stable currency.
Taiwan equities benefitted from strong results from semiconductor companies driven by robust AI spending.
Chinese equities rallied upon government measures undertaken to stimulate local demand and support the property sector.
The MSCI USA Quality and Russell 1000 Growth Indexes outperformed the broader S&P 500 Index and have substantially outperformed the Russell 1000 Value Index over the past 12 months.
Both indexes have benefitted from over-weights to the US technology and communication services sectors (mainly internet companies).
However, there has been a significant bifurcation of performance within Quality stocks. Non-technology quality stocks have materially underperformed their quality stock counterparts in technology sectors. Since active managers have high active shares, they tend to underweight exposure to the Magnificent Seven and, in some cases, to the broader technology sector. As such, US active managers focusing on quality companies(but underweight tech) have generally underperformed their respective US benchmarks over the past three years, and especially over the past 12-18 months.
For investors with a mid-term time frame, we continue to believe that stocks of high-quality companies will outperform given their strong business models, superior revenue and earnings growth and strong returns on capital.
Over shorter-term time frames, these companies may underperform given their recent strong outperformance (especially technology and communication services stocks) and elevated investor expectations which may prove challenging to exceed.
Valuation
US markets are expensive relative to history and relative to government bonds.
There is nuance to the S&P 500’s valuation however. While the market-cap-weighted S&P 500 Index trades at 21.8x NTM P/E, the equal-weighted S&P 500 trades at 16.5x NTM P/E (in line with historical averages).
The S&P 500 has a high concentration among a relatively narrow set of stocks, and the technology and communications sectors account for 43% of the index. Although the S&P 500’s valuation may look expensive relative to history, this increase seems mainly due to the changing composition of the index and its shift towards much higher quality companies that have exhibited staying power, have tailwinds from secular end market growth and are consistently delivering attractive earnings growth.
US growth and quality stocks appear modestly expensive relative to historical averages.
Operating fundamentals for the technology and communication services (internet) sector have been robust over the past 12 months. Revenue growth has accelerated while cost reduction continues, leading to outsized earnings growth.
However, YOY comparisons become more difficult in H2 2024 and 2025. Higher valuations coupled with lofty investor expectations may cause these stocks to face pullbacks if results falter.
Investors will especially scrutinize expense levels and capital spending regarding AI plans, which seem to be accelerating.
US value stocks (healthcare, energy, financials, and consumer staples) appear fairly valued relative to history.
Operating fundamentals appear mixed across sectors regarding underlying demand and cost pressures.
International developed markets are valued in line with historical averages.
US large-cap equity market valuations are highly expensive relative to government bonds.
The S&P 500 presently trades at 21.8x consensus NTM earnings.
Historically, the S&P 500 earnings yield (inverse of multiple) has averaged 200-300bps over 10-year Treasuries. With 10-year Treasuries yielding 4.2%, at first glance, a 13.5x-16.0x forward EPS multiple is “fair” for the S&P 500 based on relative valuations to bonds.
However, most investors do not expect the 10-year Treasury to remain at 4.2% for an extended period. If the 10-year was to retreat to 3.5%, a fair valuation of 16.0x-18.0x forward EPS is more reasonable (based on historical relationships).
Again, we can debate whether these historical relationships should hold given the changes in sectoral composition for the S&P 500 and the sustainable secular growth trajectories associated with several stocks within the technology sector (largest weighting in the S&P 500).